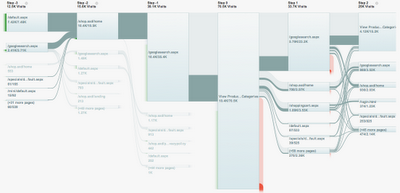
Google has recently launched “Flow Visualization” in Google Analytics, a tool that allows you to analyze site insights graphically, and instantly understand how visitors flow across pages on your site
The new Flow Visualization Feature provides a much clearer picture of how website visitors actually flow through a site with regards to your
goals.Visitors Flow
The Visitors Flow view provides a graphical representation of visitors’ flow through the site by traffic source (or any other dimensions) so you can se
e their
journey, as well as where they dropped off. You’ll find this visuali
zer on the left hand navigation menu, where you’ll see a new “Visitors Flow” link under the Visitors section.

Nodes are automatically clustered according to an intelligence algorithm that groups together the most likely visitor flow through a site.
The visualization highly interactive. You can interact with the graph to highlight different pathways, and to see information about specific nodes and connections. For example, if you want to dive deeper into your “specials” set of pages, you can hover over the node to see more at a glance.

Let's say you just launched a new promotion, and you want to see how the promotional page is doing with regards to conversions. With the new Visitors Flow report, you can click on your promotional page to see how much traffic is coming to it, where it came from and how many people "drop-off" the page altogether.
To take this a step further, you can drill down into an
y node by “exploring the traffic” through the node. In this case, you can see how visitors coming specifically from Google search journeyed across your site.

Goal Flow
Goal Flow provides a graphical representation for how visitors flow through your goal steps and where they dropped off. Because the goal steps are defined by the site owner, they should reflect the important steps and page groups of interest to the site. In this first iteration, we’re supporting only URL goals, but we’ll soon be adding events and possibly other goal types.

You can find the Goal Flow visualizer in the Conversions > Goals section of the “Standard Reporting Tab.” Goal Flow helps you understand:
- The relative volume of visits to your site by the dimension you choose (e.g. traffic source, campaign, browser)
- The rates at which visitors abandon different pathways
- Where and how visitors navigate each of the steps that you defined
- How the visitors interacted with your site, including backtracking to previous goal steps
You can also apply any advanced segments to a Flow Visualizer. In addition, for those who want to see how visitors arrive at a page (or pages) of interest, they can select that page (or pages) and visualize “backward”. Such “reverse paths” could help site owners identify suboptimal placement of content. Similarly, “forward” paths from a page (or pages) can be visualized to understand most visited pages or to see visitor flow leakages that a site owner might be unaware of.

Pages before and after the node of interest are automatically grouped based on the most common “visitor” flows, and we’re building continued improvements to help group together sensible visitor paths and page nodes.
If you don’t have goals or goal funnels already set up, don’t worry. You can create a new goal or goal funnel from your profile settings and check it out right away - it works backwards on your historical data.
These two views are our first step in tackling flow visualization for visitors through a site, and we look forward to hearing your feedback as all users begin experiencing it in the coming weeks. We’re excited to bring useful and beautiful tools like these to help you understand your site, so stayed tuned for more!
How to use it
Please have a look to the following videos to know more on GA Flow Visualization:
Video 1